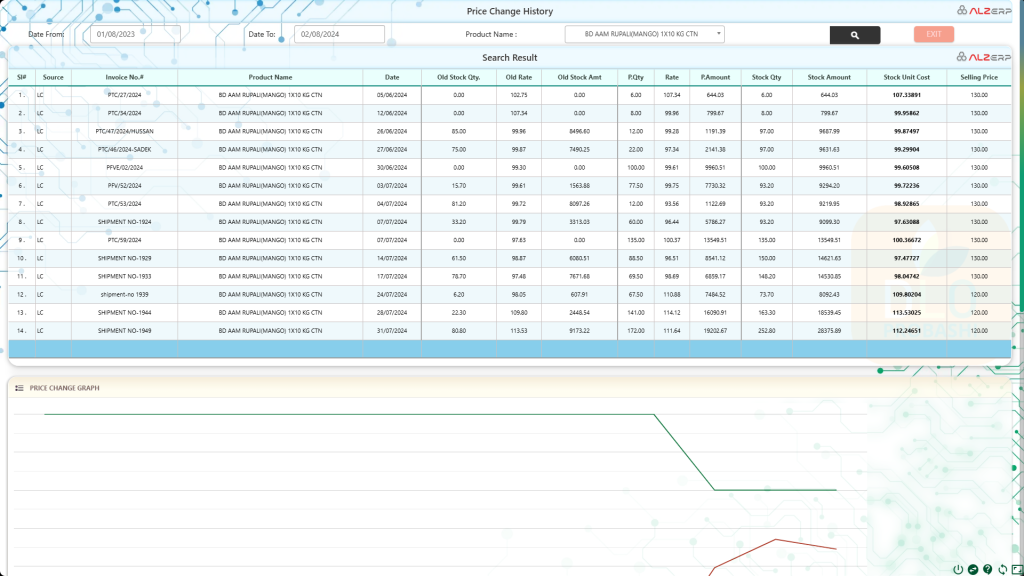
ALZERP’s Product Price Change History feature offers a comprehensive analysis of product pricing trends by tracking historical purchase and sales data. This powerful tool empowers businesses to make informed decisions regarding pricing, purchasing, and sales strategies, ultimately optimizing profitability through data-driven insights.
Key Features:
- Date Range Selection: Allows users to specify the desired timeframe for price history analysis.
- Product Search: Enables users to select the product for which price changes are to be tracked.
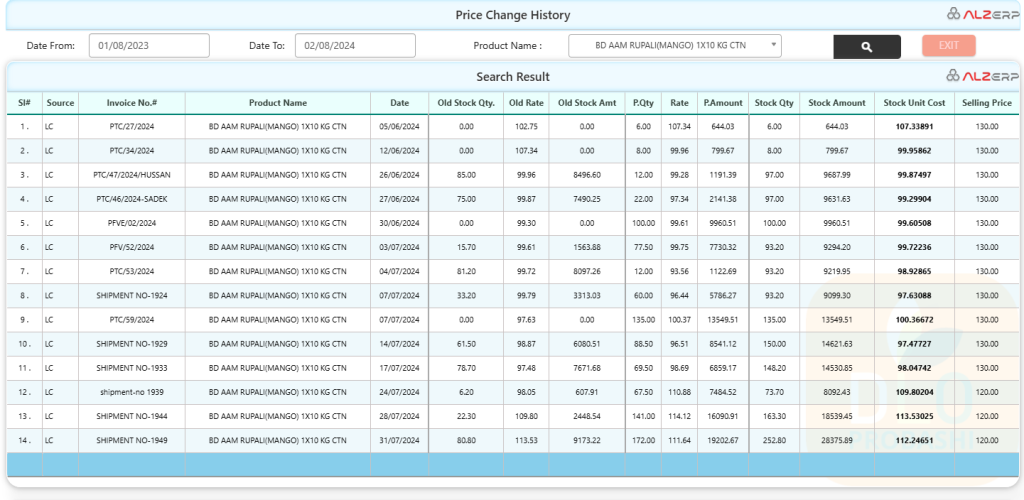
- Price Comparison Table: Displays a detailed comparison of purchase costs and sales prices over the selected period, including quantities, amounts, and unit costs.
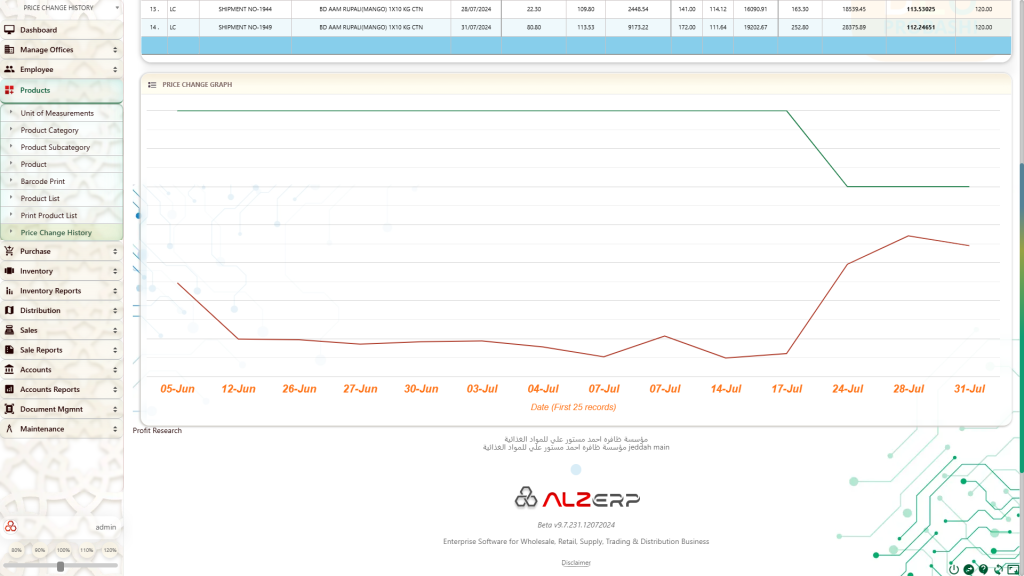
- Price Change Graph: Visualizes the price fluctuations through a line chart, providing a clear overview of trends.

Form Fields for Searching Products Price Change History: #
- Date From:
- Input Field: Specify the start date for the price change history search (e.g., 01/08/2024).
- Date To:
- Input Field: Specify the end date for the price change history search (e.g., 02/08/2024).
- Product Name:
- Input Field: Enter the product name to search for its price change history (e.g., AFIA CORN OIL (GALLON) 4X2.9LTR CTN).
Search Result Data Table: #
The search results are displayed in a data table with the following columns for detailed comparison of prices:
- Sl#:
- Serial number of the record.
- Source:
- Indicates the source of the data entry (e.g., purchase order, sales transaction).
- Invoice No.#:
- Invoice number associated with the price change.
- Product Name:
- Name of the product.
- Date:
- Date of the price change.
- Old Stock Qty.:
- Quantity of stock before the price change.
- Old Rate:
- Rate per unit before the price change.
- Old Stock Amt:
- Total stock amount before the price change.
- P.Qty:
- Quantity purchased during the transaction.
- Rate:
- New rate per unit after the price change.
- P.Amount:
- Total purchase or sales amount during the transaction.
- Stock Qty:
- Updated stock quantity after the transaction.
- Stock Amount:
- Updated total stock amount after the transaction.
- Stock Unit Cost:
- Unit cost of the stock after the price change.
- Selling Price:
- Selling price per unit after the price change.
Price Change Analysis: #
- Line Chart Graph:
- Displays a visual representation of purchase costs versus sales prices over time.
- Helps in identifying trends and patterns in price changes.
- Price Change Points by Dates:
- The line chart includes data points for the first 25 records within the specified date range, showing how prices have fluctuated over time.
Features and Benefits: #
- Detailed Price History:
- Allows users to track historical price changes for specific products, providing insights into cost management and pricing strategies.
- Comprehensive Data Comparison:
- The data table offers a side-by-side comparison of old and new prices, stock quantities, and amounts, making it easier to analyze the impact of price changes.
- Visual Analysis:
- The line chart graph provides a visual representation of price trends, helping users quickly identify significant changes and trends over time.
- Improved Decision-Making:
- By understanding the historical price changes, businesses can make more informed decisions about future pricing, purchasing, and sales strategies.
- Enhanced Financial Control:
- Enables better control over profit margins by closely monitoring purchase costs versus sales prices.

How it Works:
- Date Selection: Specify the start and end dates for the price history analysis.
- Product Selection: Choose the product for which price changes are to be tracked.
- Data Generation: The system retrieves purchase and sales data for the selected product and period.
- Report Generation: Displays the price change history in tabular and graphical formats.
Other Benefits:
- Price Trend Analysis: Identifies price patterns and fluctuations over time.
- Profitability Analysis: Evaluates the impact of price changes on product profitability.
- Inventory Valuation: Supports accurate inventory valuation based on cost changes.
- Decision Making: Provides data for informed pricing and purchasing decisions.
Example Use Case: #
A business wants to analyze the price changes for “AFIA CORN OIL (GALLON) 4X2.9LTR CTN” over the past month. Using the Research Product Price Change History feature, they can:
- Enter the Date Range:
- Specify the date range from 01/08/2024 to 02/08/2024.
- Search by Product Name:
- Enter the product name “AFIA CORN OIL (GALLON) 4X2.9LTR CTN.”
- Review the Data Table:
- Analyze the detailed comparison of old and new prices, stock quantities, and amounts for each transaction within the specified date range.
- Visualize the Price Changes:
- Examine the line chart graph to understand the trends in purchase costs versus sales prices over the selected period.
- Make Informed Decisions:
- Use the insights gained from the analysis to adjust pricing strategies, negotiate better purchase terms, or optimize inventory management.
Conclusion: #
The Research Product Price Change History feature in ALZERP Cloud ERP software is a powerful tool for tracking and analyzing historical price changes. By providing detailed data comparisons and visual analysis, it enables businesses to make informed decisions about pricing, purchasing, and sales strategies, ultimately enhancing financial control and profitability.

Sign up for your free lifetime account of Cloud ERP Software and start transforming your business today!
– Create an account now –


